from VCD-4480 syllabus
U.S. Census Data
Use the ADVANCED SEARCH, a menu-driven option, for accessing data by county and/or city.
You may want/need to use the American FactFinder. https://factfinder.census.gov/faces/nav/jsf/pages/index.xhtml until all the features of the "Explore Census Data" are available.
This US map is a visual representation of the population density and racial diversity in the United States. The 308,745,538 dots represent "each person residing in the United States at the location they were counted during the 2010 Census."
http://demographics.coopercenter.org/racial-dot-map/
Image Copyright, 2013, Weldon Cooper Center for Public Service, Rector and Visitors of the University of Virginia (Dustin A. Cable, creator)
Statista is the leading statistics company on the Internet. Statista aggregates data on a professional level from different institutes and sources. There are over 80,000 topics from more than 18,000 different sources available.
Each statistic can be downloaded in different formats so that they can be integrated into the document (Graphic PNG file, PowerPoint file, PDF file and Excel chart).
The Big Radius Tool is intended to provide “gross” numbers for a mileage-based radius, beginning at 50 miles and going up to 500 miles. Counties are aggregated, so this isn’t a hyper-precise tool but is intended to provide intelligence on the counties within a large (50 miles or more) radius.
It’s easy—just type in the name of a city or county and use the “autofill” to choose the center point of the radius. Then use the slider to increase or decrease the radius (minimum is 50 miles).
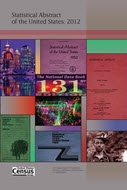
The Statistical Abstract of the United States,published since 1878, is the authoritative and comprehensive summary of statistics on the social, political, and economic organization of the United States. Abstracts for 1878 through 2012 are available at the US Census website (link above.)
Use the Abstract as a convenient volume for statistical reference, and as a guide to additional resources.

The 2012 Edition was the last edition published by the US Government. Since 2013 the Statistical Abstract of the United States has been published by ProQuest.
Selected print copies from the 1960's through the current year are available in the Reference section of the Morgan Library: